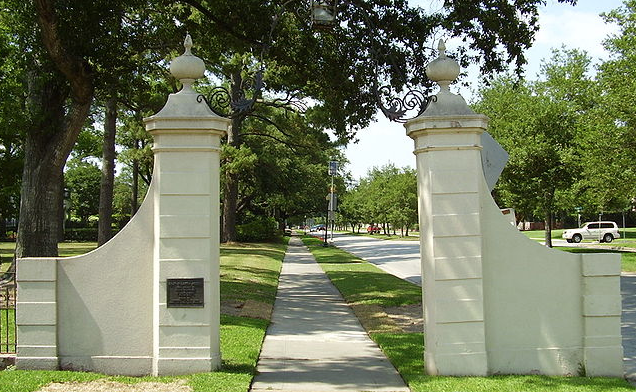
In which Greater Houston neighborhood and suburb did homes sell the fastest in the third quarter 2016? Utilizing our REAL DATA 2016 report, we took a deeper look at the market trends and put together the following table to give you the answer.
DOM By Neighborhood
| Neighborhood | Days on Market (2016 average) | Transactions (YTD) |
|---|---|---|
| Downtown | 60 | 143 |
| Medical | 67 | 1066 |
| Montrose | 71 | 1472 |
| Westchase | 73 | 702 |
| Meyerland | 75 | 877 |
| West Houston | 75 | 2066 |
| West University | 76 | 354 |
| Galleria-uptown | 78 | 1637 |
| Midtown | 79 | 265 |
| River Oaks | 81 | 946 |
DOM By Suburb
| Suburb | Days on Market (2016 avg.) | Transactions (YTD) |
|---|---|---|
| Meadows Place | 57 | 57 |
| Stafford | 61 | 129 |
| Panorama Village | 62 | 44 |
| Webster | 63 | 167 |
| Deer Park | 65 | 399 |
| Sugarland | 65 | 26 |
| Fresno | 67 | 397 |
| Friendswood | 67 | 877 |
| El Lago | 69 | 61 |
| Taylor Lake | 70 | 26 |

