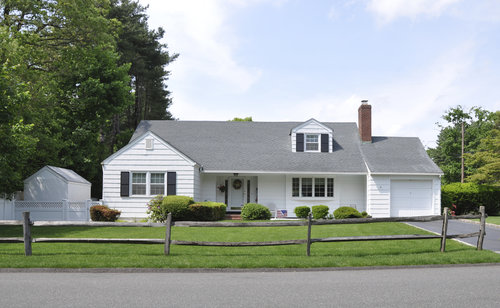
Starter homes in the Houston area remain relatively affordable, but they are slipping out of reach for many consumers.
That was the finding of a very interesting new study from Trulia, which assessed the status of starter homes in a housing market that is growing increasingly pricey and unaffordable.
Here in Houston, the median list price for starter homes is currently $104,967, and it requires 27.7 percent of the typical starter buyers’ income to purchase such a home. Although those numbers are relatively low – in places like New York and Boston, for instance, starter homes are more than double the price, and 50-plus percent of starter income is needed to buy – Houston’s list price is still up 16.6 percent from a year ago, and starter home inventory is slightly down. As a result of those trends, the share of income needed has risen 27.06 percent since 2012, and it comes at a time when wages and incomes remain flat for most prospective buyers of starter homes.
Starter homes in peril?
Houston’s starter home market is largely consistent with the national trends: inventory is down 12.1 percent, income requirements are up 1.9 percentage points, and starter homes comprise less than 25 percent of available inventory, while premium homes comprise more than half. It is all consistent with our past reporting on new construction, which has tracked how homebuilders have dramatically shifted their focus to homes for upper-income consumer.
See our chart below for a deeper look at the starter home market:
| U.S. Metro | Median Starter Home List Price, 2016 Q4 | Starter Home List Price Change, 2015 Q4 to 2016 Q4 | Starter-Homebuyer Income Needed to Buy | Starter Home Inventory Change, 2015 Q4 to 2016 Q4 (Percentage Change) |
|---|---|---|---|---|
| Atlanta | $80,000 | 7.5% | 20.2% | -1.4% |
| Boston | $261,583 | 7.7% | 56.4% | -3.2% |
| Chicago | $108,633 | 9.0% | 32.2% | -0.6% |
| Denver | $236,000 | 16.1% | 41.9% | 1.8% |
| Houston | $104,967 | 16.6% | 27.7% | -0.6% |
| Los Angeles | $349,967 | 8.8% | 90.6% | -1.1% |
| Miami | $152,317 | 17.2% | 51.6% | 0.1% |
| New York | $215,000 | 1.7% | 53.5% | -2.0% |
| Philadelphia | $59,967 | 0.1% | 21.2% | 4.3% |
| Phoenix | $150,633 | 13.3% | 37.2% | 1.0% |
| San Francisco | $751,333 | 7.4% | 119.7% | 3.1% |
| Seattle | $281,650 | 11.2% | 49.4% | 4.5% |

