Southwest Katy is the top-selling market in Greater Houston.
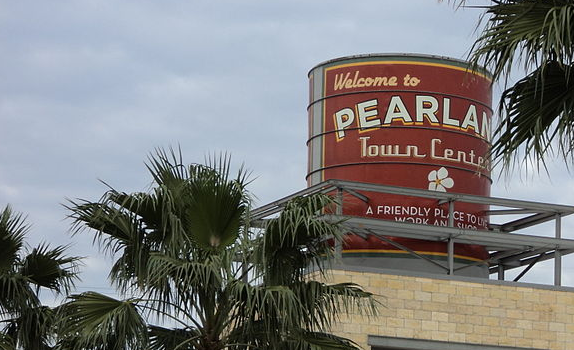
According to data from the Houston Association of Realtors’ Multiple Listing Services, in the 12 months preceding this past September, there were 2,431 closed transactions in the Katy market. A close second was Pearland, where agents closed 2,373 sales during the same period.
Sales in the area are not following the same record-setting track they did in 2014, before the city’s energy sector was in such stark turmoil. But at least in some areas, as the HAR MLS data shows, the numbers are still strong.
See our full top 15 most active markets list below:
| Greater Houston Markets | Transactions (10/2015-9/2016) | Transactions (10/2014-9/2015) | % Change |
|---|---|---|---|
| Katy – Southwest | 2431 | 2535 | -4.10% |
| Pearland | 2373 | 2395 | -0.90% |
| Cypress North | 2029 | 1967 | 3.20% |
| League City | 1989 | 2029 | -2.00% |
| The Woodlands | 1907 | 2079 | -8.30% |
| Fort Bend County North/Richmond | 1687 | 1603 | 5.20% |
| Spring Northeast | 1675 | 1531 | 9.40% |
| Katy – North | 1565 | 1533 | 2.10% |
| Lake Conroe Area | 1528 | 1582 | -3.40% |
| Spring/Klein/Tomball | 1444 | 1327 | 8.80% |
| Cypress South | 1426 | 1321 | 7.90% |
| Spring/Klein | 1389 | 1482 | -6.30% |
| Missouri City Area | 1369 | 1446 | -5.30% |
| Bear Creek South | 1338 | 1360 | -1.60% |
| Katy – Southeast | 1297 | 1263 | 2.70% |

