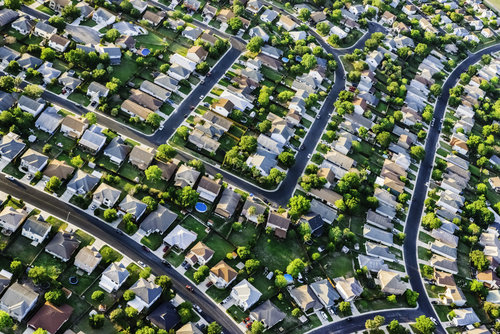
Houston’s housing market is among the most dynamic and diverse in the nation; a fact recently demonstrated in Houstonia magazine’s report on neighborhood performance since 2010.
In the five-year stretch between 2010 and 2015, median home price growth in Houston was somehow both rampant and nonexistent, according to Houstonia, which used data provided by the Houston Association of Realtors. On the high end, nowhere in the city was appreciation more pronounced than in the Plantersville Area, where prices ballooned over 160 percent during the five-year period. However, on the opposite side of the spectrum, Houston’s Greenway Plaza actually experienced regression, with prices falling 16.9 percent.
Check out our table below to see the full top 20 neighborhoods by highest and lowest price growth:
Top 20
| Neighborhood | 2015 Median Home Price | 2010-2015 Growth | 2014-2015 Growth |
|---|---|---|---|
| Plantersville Area | $232,920 | 160.30% | 46.00% |
| Treasure Island-Galveston | $119,000 | 138.50% | 6.30% |
| Deer Park | $85,000 | 105.90% | 23.20% |
| Southbelt/Ellington | $315,000 | 100.70% | 20.20% |
| Medical Center South | $1,850,000 | 100.00% | -15.90% |
| Rivercrest | $318,873 | 96.80% | 6.30% |
| Champions Area | $807,000 | 88.30% | 8.30% |
| Northeast Houston | $92,000 | 85.90% | 15.00% |
| Northwest Houston | $396,250 | 80.10% | 6.30% |
| Medical Center Area | $115,000 | 73.00% | 15.10% |
| Cypress North | $274,700 | 72.80% | 11.30% |
| Cleveland Area | $120,000 | 71.40% | 25.00% |
| Summerwood/Lakeshore | $1,599,000 | 71.00% | -7.80% |
| Clear Lake Area | $112,500 | 70.50% | 12.50% |
| Upper Kirby | $235,000 | 68.80% | 47.80% |
| Oak Forest West Area | $280,000 | 67.50% | 15.90% |
| Oak Forest East Area | $249,000 | 67.10% | 15.00% |
| Midtown-Galveston | $439,000 | 66.00% | 15.50% |
| Tyler County | $179,000 | 65.40% | 6.40% |
| North Channel | $89,000 | 64.80% | 18.70% |
Bottom 20
| Neighborhood | 2015 Median Home Price | 2010-2015 Growth | 2014-2015 Growth |
|---|---|---|---|
| Greenway Plaza | $255,000 | -16.90% | 59.30% |
| Tomball | $250,000 | -5.70% | -20.00% |
| Heights/Greater Heights | $110,000 | -4.30% | -2.20% |
| Pearland | $129,500 | -1.10% | -33.80% |
| Riverside | $800,000 | -0.10% | 0.00% |
| East End-Galveston | $212,000 | 4.40% | 12.80% |
| Lake Conroe Area | $115,000 | 6.20% | -4.10% |
| Brookshire | $123,550 | 6.50% | 1.30% |
| Humble Area East | $67,250 | 8.00% | -18.40% |
| Webster | $704,000 | 12.60% | -0.10% |
| Cypress South | $129,900 | 13.20% | 1.50% |
| Trinity Area | $767,500 | 13.70% | -7.50% |
| Crosby Area | $242,500 | 14.40% | 3.20% |
| Friendswood | $409,000 | 15.30% | 2.30% |
| Highland Village/Midlane | $131,000 | 15.90% | 1.20% |
| Knollwood/Woodside Area | $92,000 | 16.20% | 12.30% |
| Energy Corridor | $303,371 | 16.70% | 0.60% |
| Kingwood NW/Oakhurst | $223,419 | 17.00% | 4.00% |
| Katy-Southwest | $290,000 | 17.20% | 3.60% |
| League City | $120,000 | 18.20% | 7.10% |

