
The starter home sector is faring worse than the housing market as a whole, according to a recent report by Trulia.
Despite overall housing inventory being up 3.3 percent, starter home inventory decreased 14.2 percent from last year to this year. Meanwhile, inventory for premium homes rose 13.3 percent.
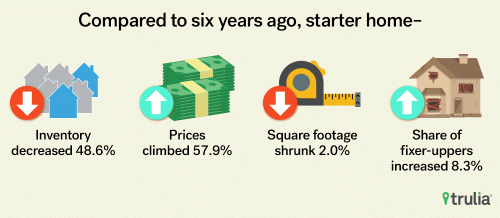
Starter homes also had a higher price increase than any other housing segment. The median list price for starter homes increased 9.6 percent, while trade-up homes increased 7.5 percent and premium homes increased 5.2 percent.
The portion of income needed to buy a starter home rose 4.2 percentage points from last year, up to 41.2 percent. Financial experts recommend no more than 30 percent of income be dedicated to a mortgage. The portion of income for trade-up homes rose from 24.7 percent to 26.9 percent, and for premium homes rose from 13.5 percent to 14.6 percent.
In addition to price hikes and inventory wanes, the quality of starter homes is also in decline, with the average starter home being 53.3 years old — nine years older than the average starter home in 2012.
Starter homes also average 2 percent less square footage than in 2012, despite higher price point homes having an 8.6 percent increase in average square footage. The average square footage of a starter home in 2012 was 1,211, while today the average is 1,187.
Fixer-uppers make up 11.2 percent of the current starter home market, up from 10.3 percent in 2012. Among all housing segments, fixer-uppers decreased by 0.6 percent to a total of 4.8 percent.
While 2017 was the best year for homebuilding since 2007, the starter home segment has yet to see the benefits. “Starter home buyers are facing a perfect storm of the lowest inventory, the highest prices and the lowest levels of affordability among all housing segments,” Cheryl Young, senior economist at Trulia, said in her post.
| 2018 Q1 Median List Price | 2018 Q1 Share | 2018 Q1 Inventory | % of Income Needed to Buy Median Price Home | % Change in Median List Price Q1 2017 to Q1 2018 | % Change in Inventory Q1 2017 to Q1 2018 | |
| Starter | $180,931 | 21.5% | 217,717 | 41.2% | 9.6% | -14.2% |
| Trade-Up | $311,234 | 22.9% | 231,691 | 26.9% | 7.5% | 0.9% |
| Premium | $646,188 | 55.6% | 563,468 | 14.6% | 5.2% | 13.3% |