
The Case-Shiller continued its seasonal declines in November, reaching new post-bubble lows.
Standard & Poor’s (S&P) released its latest Case-Shiller Home Prices Indices today, showing that home prices fell again from October to November and posted new post-housing bubble lows for home values.
Both the 10- and 20-City Composites fell by 1.3 percent monthly, while annually, both composites were also down, with respective declines of 3.6 and 3.7 percent.
For Chicago: After a couple indices of positive results, Chicago home values suffered from October to November, falling 3.4 percent monthly (the biggest drop of the sampled areas) and 5.9 percent year-over-year. Chicago was not alone, though. 18 of the 20 metropolitan areas surveyed by S&P posted annual declines (only Washington D.C. and Detroit were positive), and only one city, Phoenix, posted a monthly increase.
For Miami: Spurred on by international investments, values in Miami were relatively stellar, declining by just 0.5 percent monthly and 0.2 percent year-over-year. 18 of the 20 metropolitan areas surveyed by S&P posted annual declines (only Washington D.C. and Detroit were positive), and only one city, Phoenix, posted a monthly increase.
For Houston: Houston is not tracked by S&P, but home values in Dallas, which is tracked, were down by just 1.3 percent monthly and 0.8 percent annually, among the smallest declines in the nation. 18 of the 20 metropolitan areas surveyed by S&P posted annual declines (only Washington D.C. and Detroit were positive), and only one city, Phoenix, posted a monthly increase.
David M. Blitzer, the chairman of S&P’s Index Committee, said that home values have fallen in spite of positive economic numbers.
“Despite continued low interest rates and better real GDP growth in the fourth quarter, home prices continue to fall,” Blitzer said. “The trend is down and there are few, if any, signs in the numbers that a turning point is close at hand.”
The Case-Shiller is a non-seasonally adjusted index, and because of that, Blitzer reported home values that are low, but not historically low.
“The crisis low for the 10-City Composite was April 2009,” he said. “For the 20-City Composite, the more recent low was March 2011. The 10-City Composite is now about 1.0 percent above its low, and the 20-City Composite is only 0.6 percent above its low.”
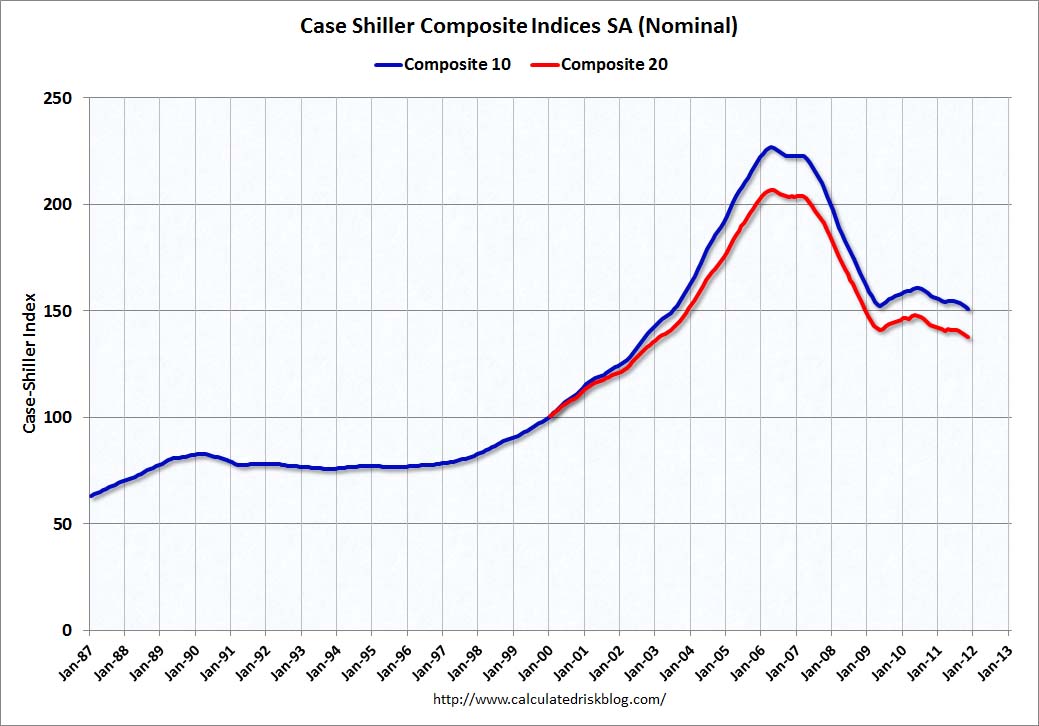
When seasonally-adjusted, though, the indices do reach post-bubble lows, as shown by this graph by Bill McBride Calculated Risk.
“The NSA indexes are around 1% above the March 2011 lows – and these indexes will hit new lows in the next month or two since prices are falling again,” McBride wrote. “Using the SA data, the Case-Shiller indexes are now at new post-bubble lows.”
One thing McBride and Blitzer did agree on, though was the off-peak totals for the indices, which both saw at roughly 33 percent below the peaks in 2005.
In a Wall Street Journal piece on the indices, Joshua Shapiro of MFR said that supply continues to be an issue for housing.
“The enormous supply overhang of existing homes (particularly factoring in all those in foreclosure or soon to be) promises to keep pressure on prices for some time,” Shapiro said. “We look for further declines to be registered in the quarters ahead, although in all likelihood the rate of deterioration will be nowhere near as steep as that recorded earlier in the cycle.”