
Many factors go in to a housing recovery, but how reliable are the measures of that recovery?
The new home sales data from earlier today confirms what we’ve been reporting for several weeks now – that a housing recovery is indeed in the works.
There remains considerable debate, though, on the nature and extent of that recovery, and in a new post on his Calculated Risk blog, Bill McBride assesses a number of factors influencing what he sees as a slow, but sustainable, path to recovery for housing, and the tricky interpretations that assess those factors.
Along with new home sales, which are up more than 17 percent from their lowest point, home price data is an important signifier of the recovery. In the latest Case-Shiller, though values were down from 2011, the declines were less than the year-over-year data in February, a key measure, McBride wrote, for a steadily improving housing market.
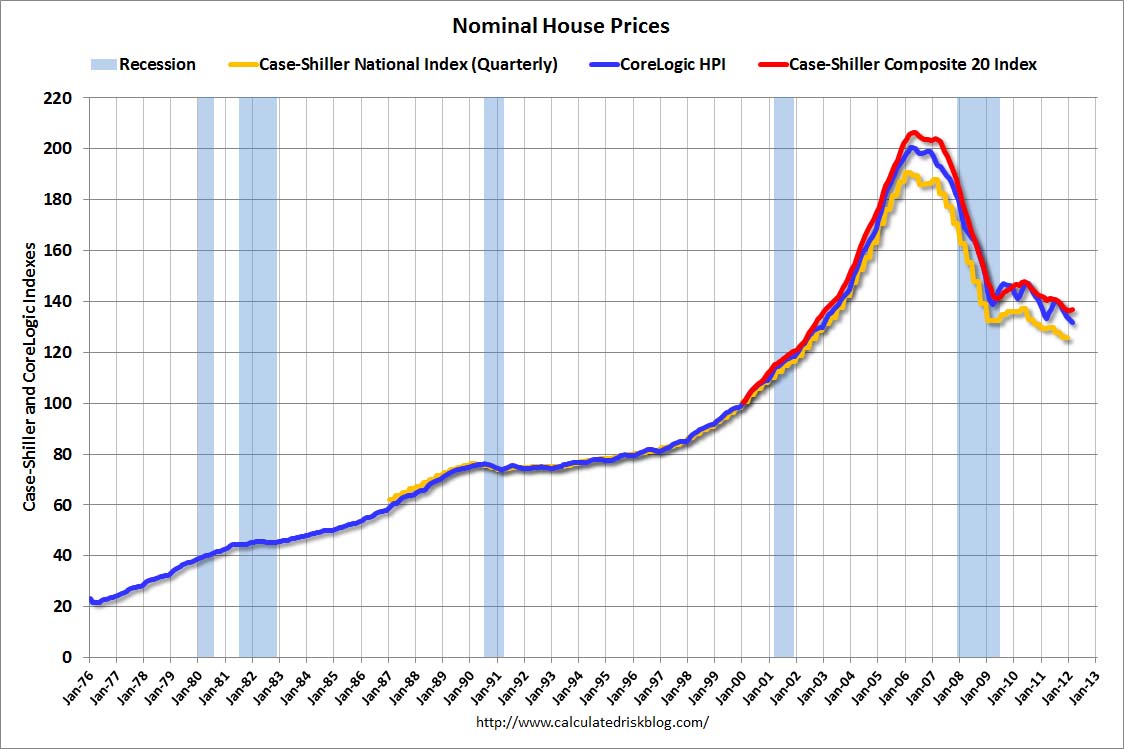
An interesting detail about the Case-Shiller, though, is that like the many other housing price indices, it uses nominal values in its assessments, not real prices that are filtered through the Consumer Price Index and consider inflation.
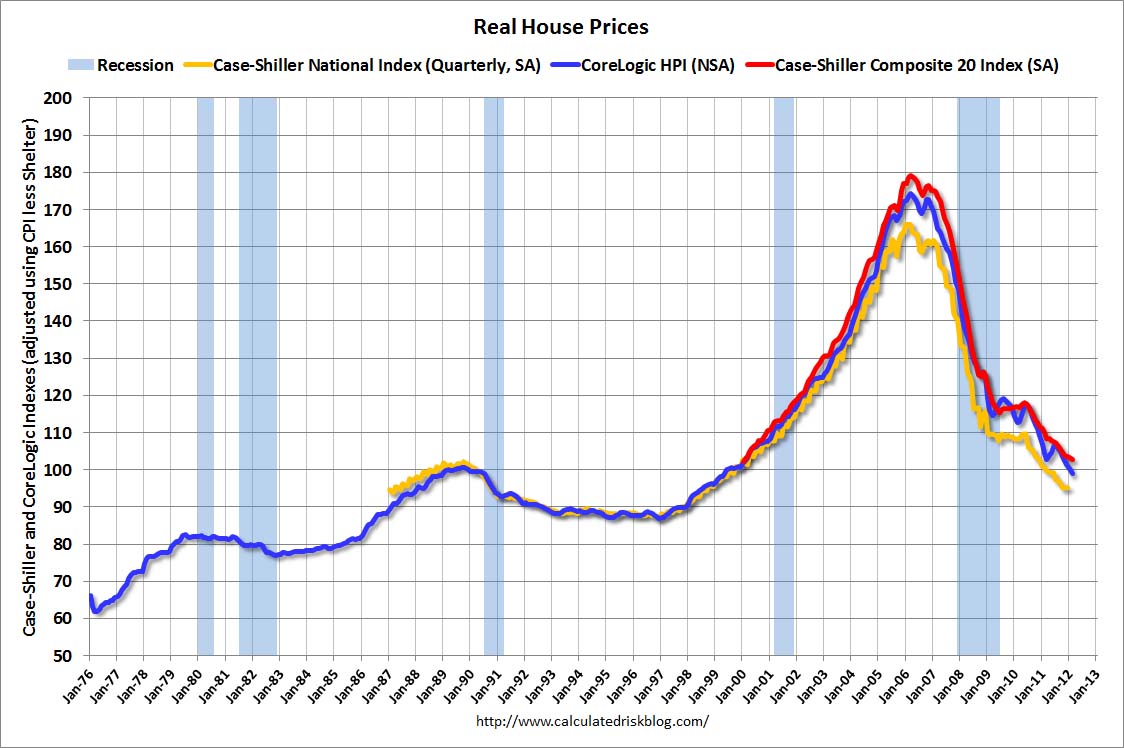
In two separate graphs, McBride compared the most recent results of the quarterly Case-Shiller, the 20-city composite Case-Shiller and the CoreLogic home index, and how real and nominal prices impacted their results. On the surface, the graphs are the same; they feature huge increases from January 1997 to January 2006, followed by steep declines to the present day. However, the graphs differ substantially from 2006 to the present day.
For instance, with the 20-City Composite index, the real graph features a lower peak at 180, compared to 203 for the nominal graph, but more important, it features a much steeper decline that brings the graph down to 101, far below the 138 of the nominal graph.
“In nominal terms, the Case-Shiller National index (SA) is back to Q3 2002 levels, the Case-Shiller Composite 20 Index (SA) is back to January 2003 levels, and the CoreLogic index (NSA) is back to January 2003,” McBride wrote. “In real terms, the National index is back to Q4 1998 levels, the Composite 20 index is back to January 2000, and the CoreLogic index back to May 1999. In real terms, all appreciation in the ’00s is gone.”
So by counting inflation, the true extent of the post-boom value depreciation can be properly assessed – but even with real prices, there is still a level of uncertainty with the Case-Shiller, which operates on a two-month lag. So although the most recent Case-Shiller just came out yesterday, it averaged closing price data from December, January and February, which means lingering transactions from as far back as September and October (which may have finally closed in those months) are counted in the data. CoreLogic’s Home Price Index attempts to correct this problem by weighing the most recent month the heaviest in its own three-month average, but as McBride points out, that comes at a price. The data may be more timely, but it is not as reliable as that of the Case-Shiller.
Concluding his views, McBride wrote, “My view is housing will remain sluggish for some time, and I expect 2012 to be another historically weak year, but better than 2011.”
It seems we’ll have to consider, though, the measures being used in judging that recovery.