
Current Market Data

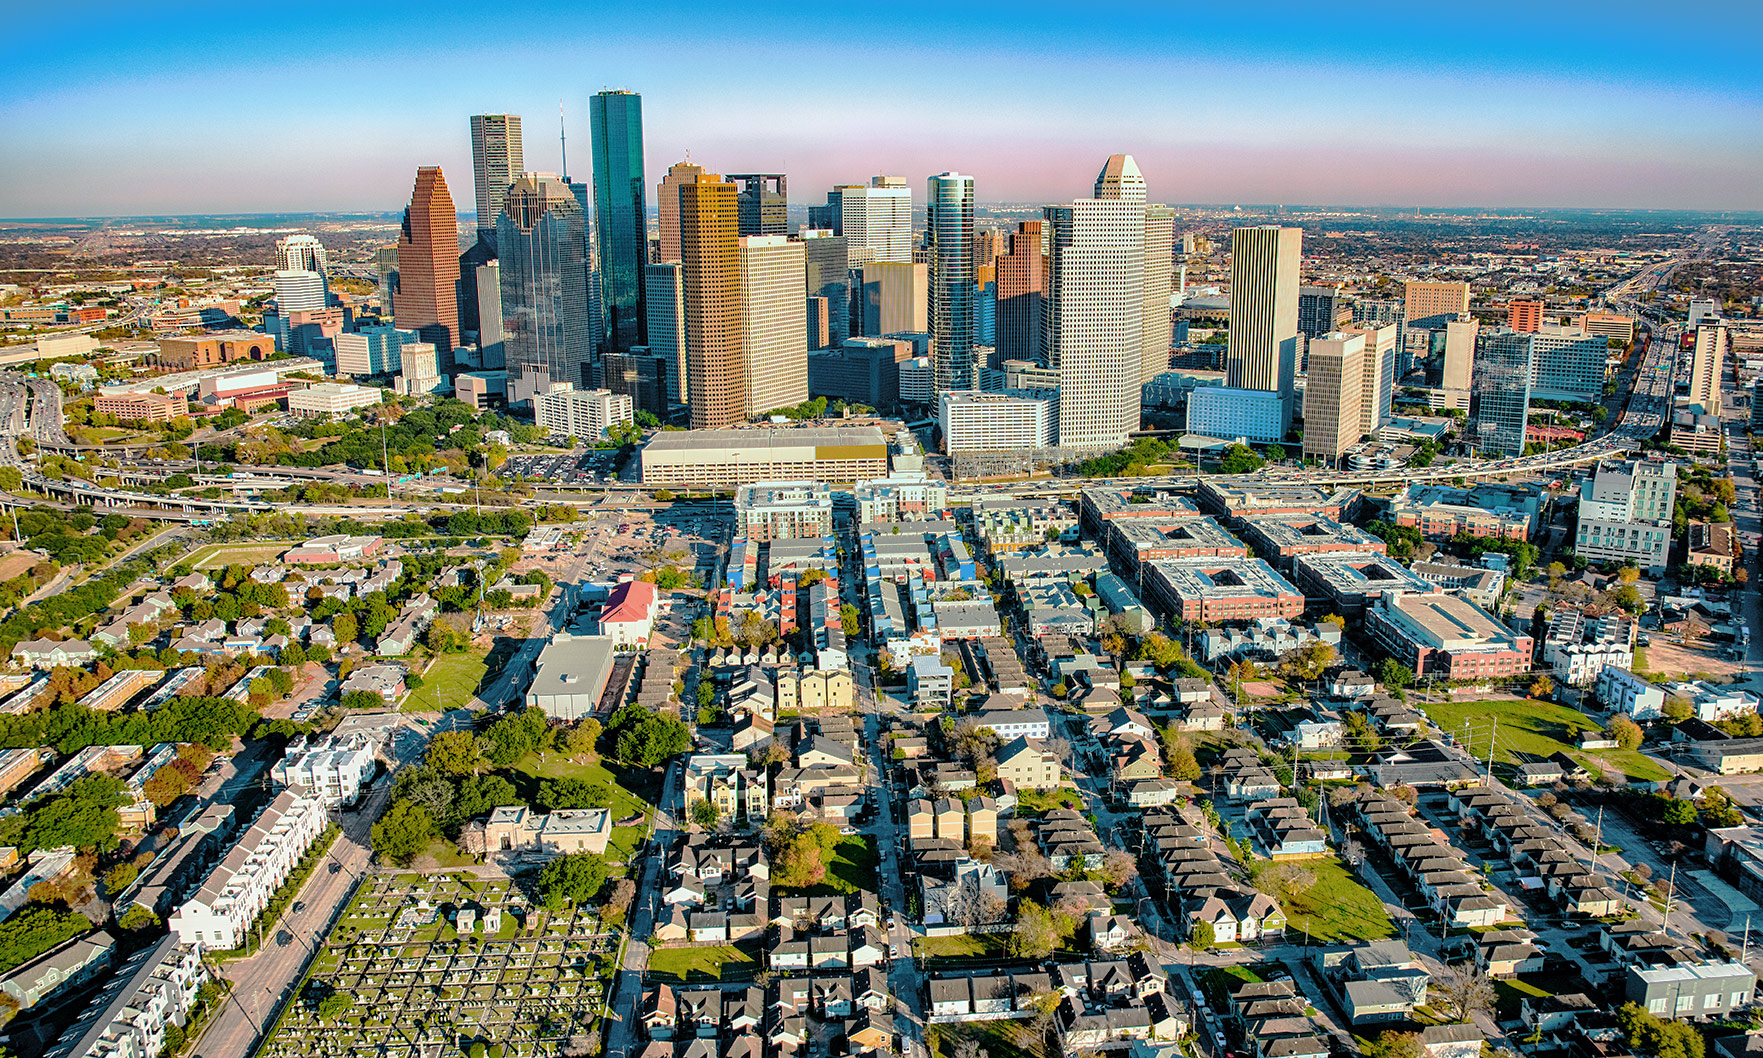
Houston made up 20% of the top-selling master-planned communities in the country, with Texas making up 30% of the list. Read more to see which communities made the cut.
July’s reading of 80 was down one point from June, but still signaled strong demand for housing, the National Association of Home Builders said.
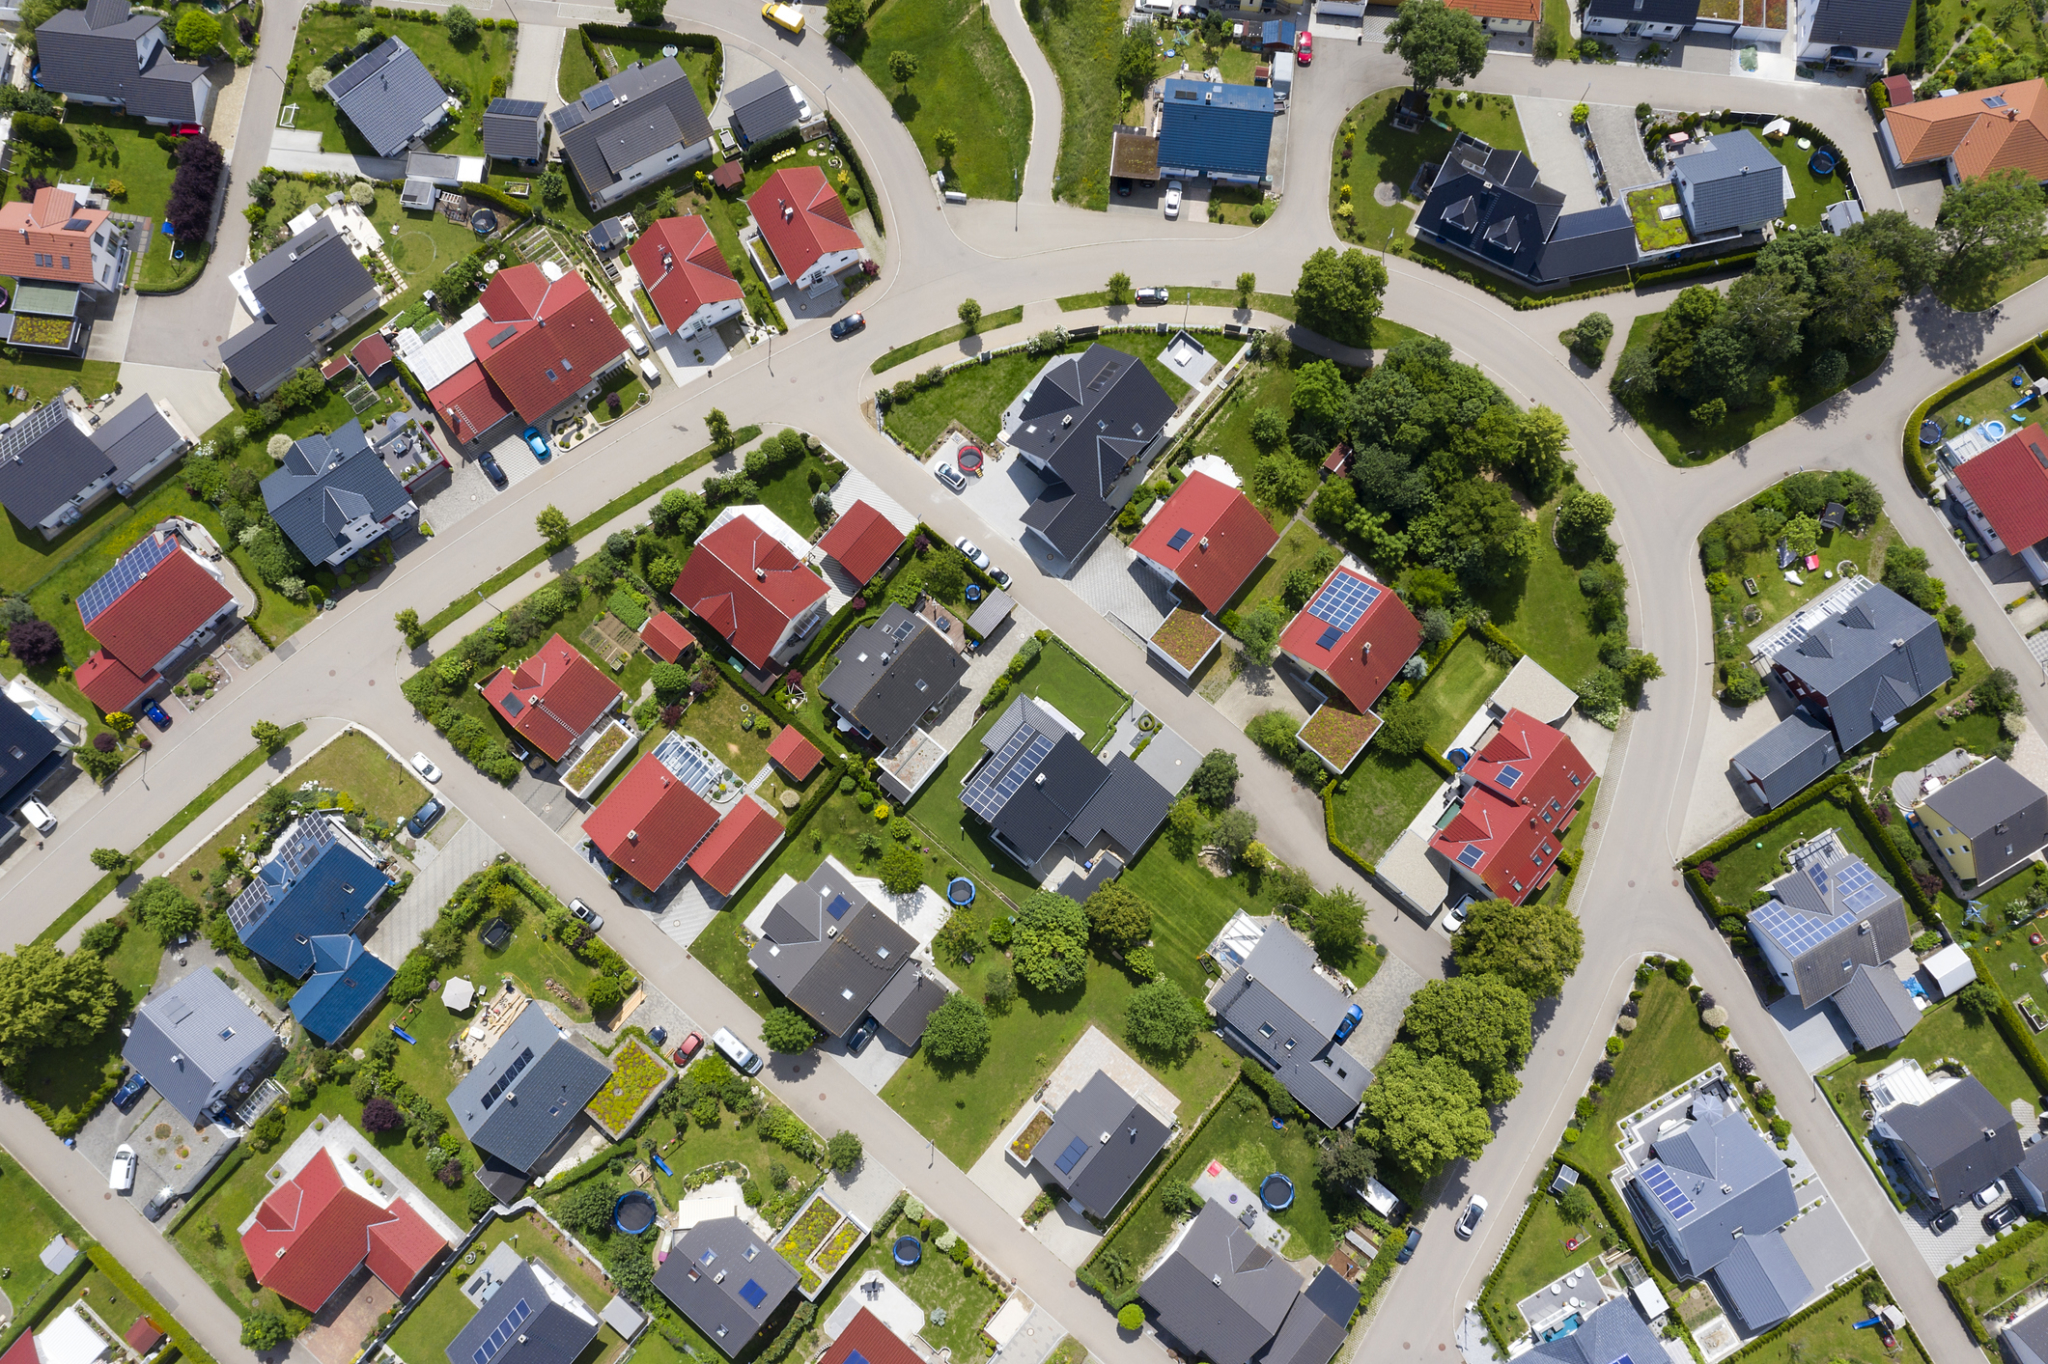
During the four-week period ended July 11, the average weekly share of homes for sale with a price drop passed 4% for the first time since September 2020.

The Houston market saw its 13th consecutive month of sales growth, although the pace slowed.

Meanwhile, the Mortgage Bankers Association’s seasonally adjusted purchase index rose 8% from the previous week.
The competitive homebuying market showed signs of loosening up last month as bidding wars dropped from May despite being higher than they were a year ago.

Adjectives reflecting the desire for privacy and physical isolation gained a place of prominence: “private,” “covered,” “quiet,” “separate” and “enclosed” were among the top 100 most-used description terms.

It could take Houston-area renters more than seven years to save for a down payment in today’s market.
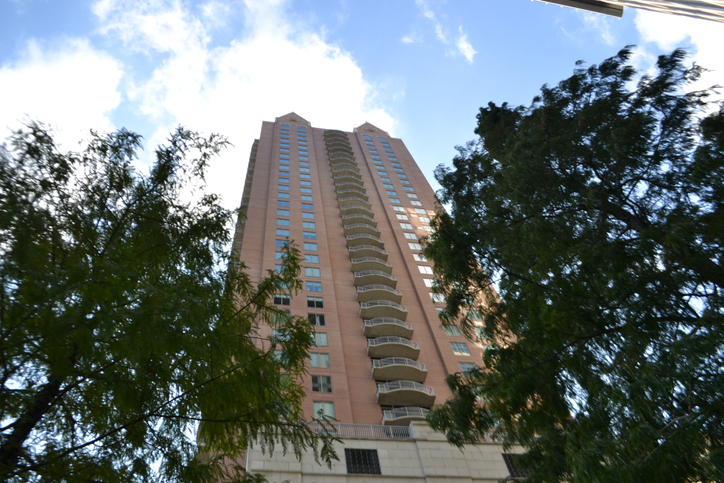
Houston rents jumped 4.3% year over year in May.

Millennials were once referred to as the “renter generation” because of their preference for apartment living in urban areas over purchasing a home in the suburbs like their Baby Boomer parents.

Housing markets across the country saw new listings growth in June, as the median list price hit yet another all-time high, and Houston was no exception.

Strong growth of single-family construction spending drove the increase, while spending on multifamily construction was flat, the National Association of Home Builders said.
“May’s strong increase in transactions — following April’s decline, as well as a sudden erosion in home affordability — was indeed a surprise. The housing market is attracting buyers due to the decline in mortgage rates, which fell below 3%, and from an uptick in listings.” — NAR chief economist Lawrence Yun
The 10-city composite index rose 1.9% on a monthly basis and 14.4% on a yearly basis, while the 20-city composite rose 2.1% monthly and 14.9% annually.

New listings also lost their momentum during the week, lowering hopes that the limited supply of homes on the market would be replenished soon.
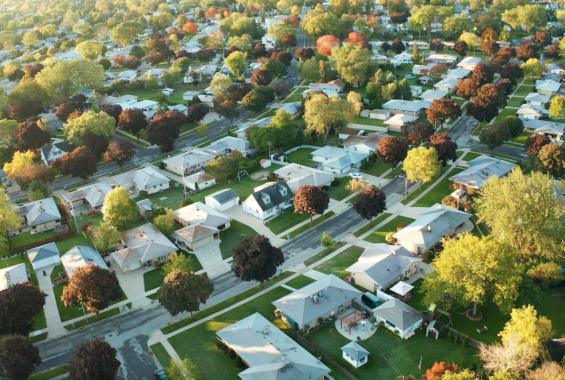
The seasonally adjusted estimate of new houses for sale at the end of May was 330,000, representing a supply of 5.1 months at the current sales rate, the U.S. Census Bureau and the Department of Housing and Urban Development reported.