We keep hearing how depressed single-family construction is and that we need more new homes, but is that really the case?
In 2013, there were 618,000 single-family housing starts, and we’re currently operating at a rate of roughly 622,000 in 2014. Those numbers compare unfavorably to the pre-bubble average of 1.1 million starts per year in the 1990s, and with that kind of contrast, one could sensibly conclude that we need more housing construction; after all, housing inventory is still quite low, and NAR pegs low home construction as a prime culprit.
However, new research from the ever-intriguing Jed Kolko at Trulia has shined a new, nuanced light on the state of home construction, and provides us with a surprising conclusion – even at its depressed levels, new home construction may still be too high.
Vacancy Rates, Formations and New Construction
There are a few concepts to understand, in order to see why new construction may be too high:
•First, household formation – the number of total households – only rose by 321,000 from 2012 to 2012, according to newly released data from the Census Bureau’s American Community Survey (ACS). Given how the adult population is growing in the U.S. (the Millennial generation is the largest generation in our country’s history), household formation should be in the 1.2 million range. So in other words, formations are a third of what they should be, and demand for housing will be less.
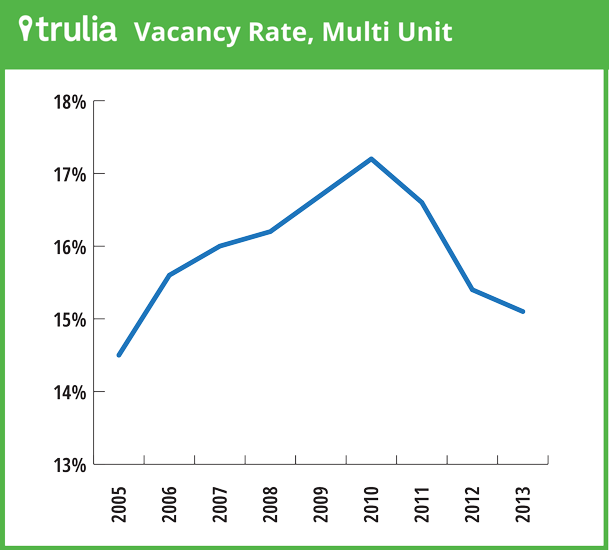
•Second, the housing vacancy rates tell a radically different story about the housing market than what we’re used to through the guise of NAR’s housing inventory numbers. First, here’s a graph from Trulia showing the vacancy rate for multifamily residences, which peaked at 17.2 percent in 2010 and has fallen steadily since then, with the demand for rentals being so strong:
Yet, look at how the vacancy rate for single-family homes has changed in recent years:
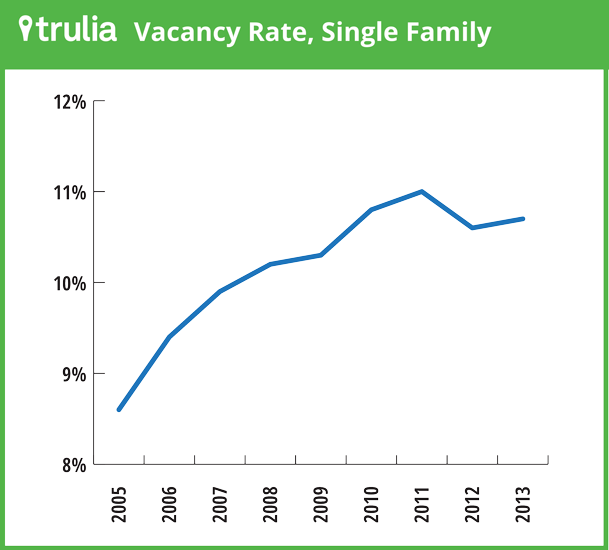
See what happened after 2010? Like multifamily, the single-family vacancy rate rose during the building boom and shot up sharply after 2008, when the economy collapsed and builders were left holding oodles of unsold inventory built during the boom. However, after a slight decline in 2011, the vacancy rate increased in 2012 to 10.7 percent, which leaves it far above the 7.4 percent of pre-bubble 2000.
So basically, nearly 11 percent of single-family housing stock is unfilled, and that’s 30 percent higher than it should be – meaning, of course, that any new construction that hits the market is doing so in an already over-supplied arena. Here’s how Kolko put it: “For the single-family vacancy rate to move back down to bubble or pre-bubble levels, the growth in households occupying single-family homes needs to exceed the growth in the single-family housing stock. In other words, to get back to normal, we gotta fill up homes faster than we build them. That didn’t happen in 2013. Even though relatively few single-family homes were built, even fewer were filled.”
The conclusions? Single-family home construction is low, but it’s still running ahead of demand and household formations, and we clearly built more in 2013 than we could fill; with the vacancy rate continuing to fall for multifamily, though, we’re offered even more evidence that if homebuilding is to recover, it will be with multifamily leading the way.